The Data Guys™ Storyhouse Platform

Spend less time on data. Spend more time finding impact.

You already collect the sign-in sheets, surveys and spreadsheets. Storyhouse turns them into reports funders trust, with every number linked to the de-identified people behind it, and a clear plan for proving what changes next. Your whole agency works in one place, each person on their own login.

Nothing is charged for 14 days. Already have an account? Sign in

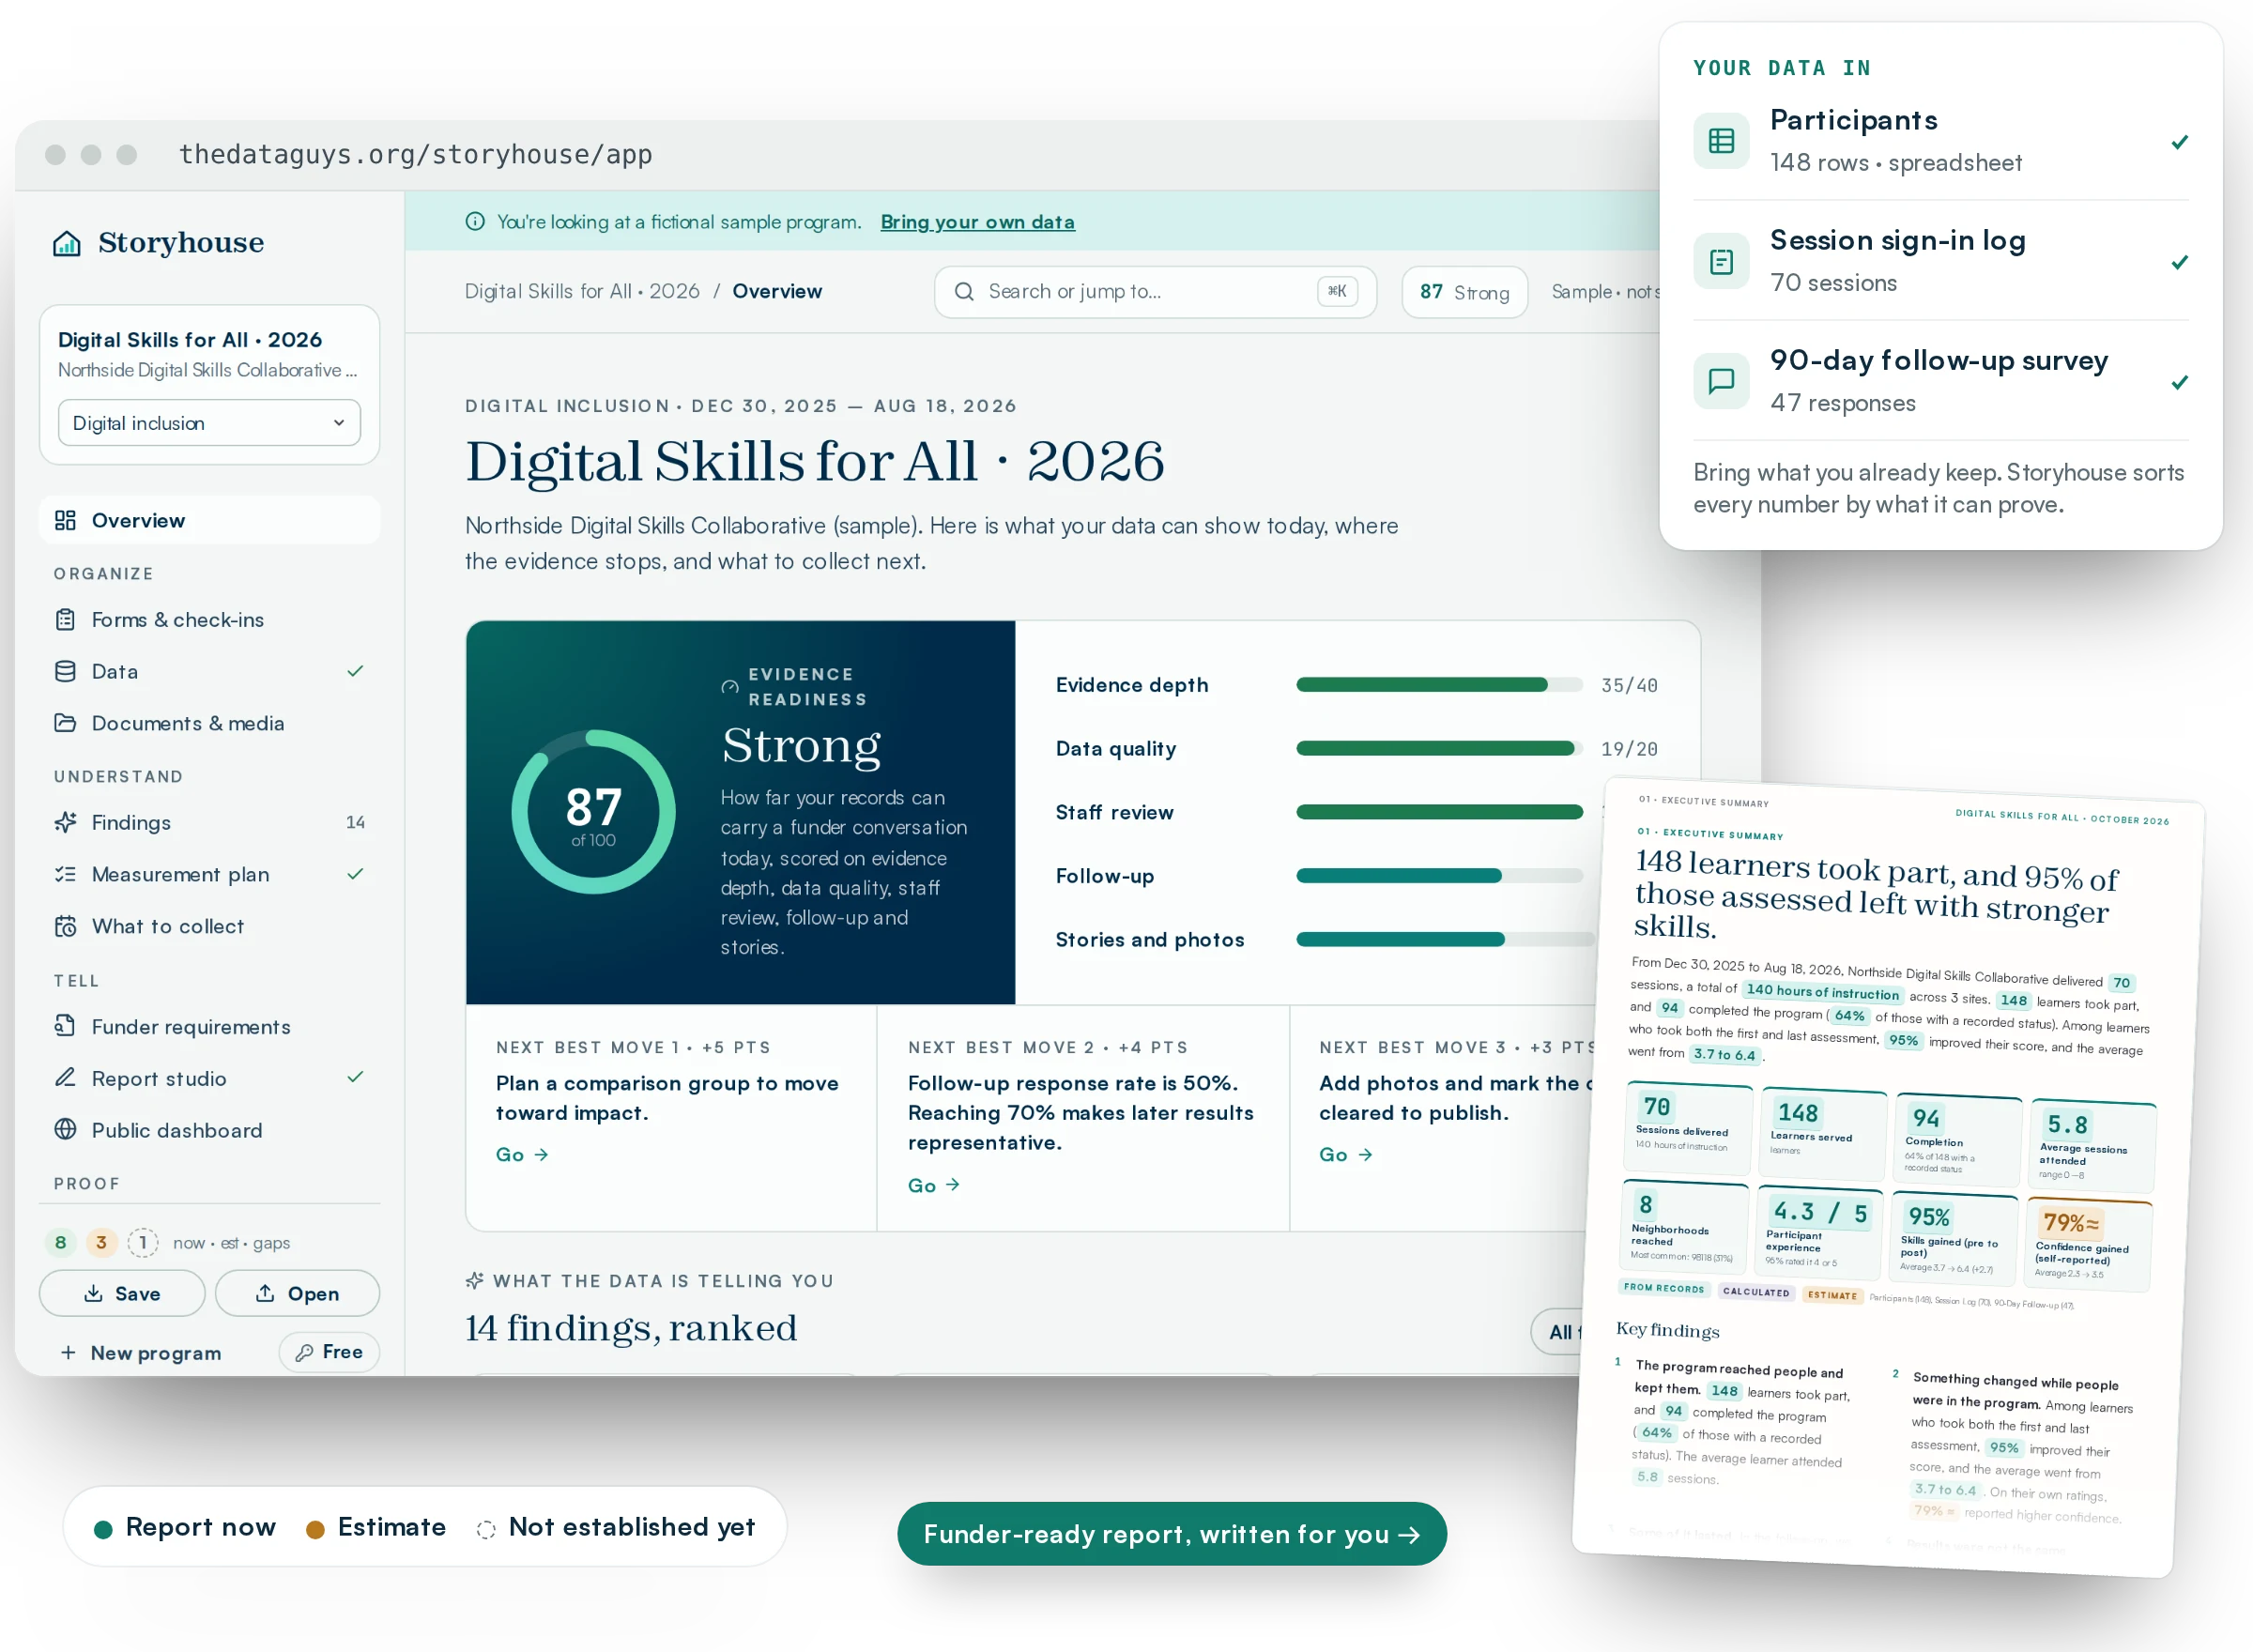
Storyhouse, nonprofit outcomes and grant reporting software, in use: a program’s spreadsheets, sign-in log and follow-up survey come in, the overview scores evidence readiness at 87 of 100 with next best moves, and a funder-ready executive summary comes out, with each number marked report now, estimate or not established yet
Why we built it

You run the program. The report shouldn’t run you.

It’s the week before the funder report is due. The sign-in sheets are in a binder, the survey is in one export, the roster is in another, and the template asks what changed for people. You know what changed. You watched it happen. Proving it is the part that eats your weekend.

Storyhouse is built for that week, and for the program director who deserves a better one. Drop in what you already have and it shows you what you can prove today, what’s an estimate and what you still need to collect. Then it writes the report, with every number open to the people behind it, so you spend your time on the program instead of the spreadsheet.

It’s the same method The Data Guys™ has used building data systems for fifteen years, packaged so a coordinator can do on a Tuesday afternoon what used to take a consultant a month.

Digital inclusionWorkforce developmentCommunity events & fairsYouth programsHousing & stability servicesHealth & wellness outreachAny program
The evidence ladder

Every number, on the right rung.

Storyhouse sorts each measure into five rungs and labels it honestly: report now, estimate, or not established yet. Your reports never claim more than your data supports.

  1. 01ActivitiesWhat you ran70 sessions delivered
  2. 02OutputsWho you reached148 learners served
  3. 03OutcomesWhat changed95% improved their scores
  4. 04Longer-term outcomesWhat lasted77% doing it on their own, three months later
  5. 05ImpactWhat the program causedNot established yet, and the plan says what it would take

Examples from the Storyhouse sample program, a fictional digital skills class.

How it works

Organize. Understand. Tell.

01 · Organize

Bring what you already have.

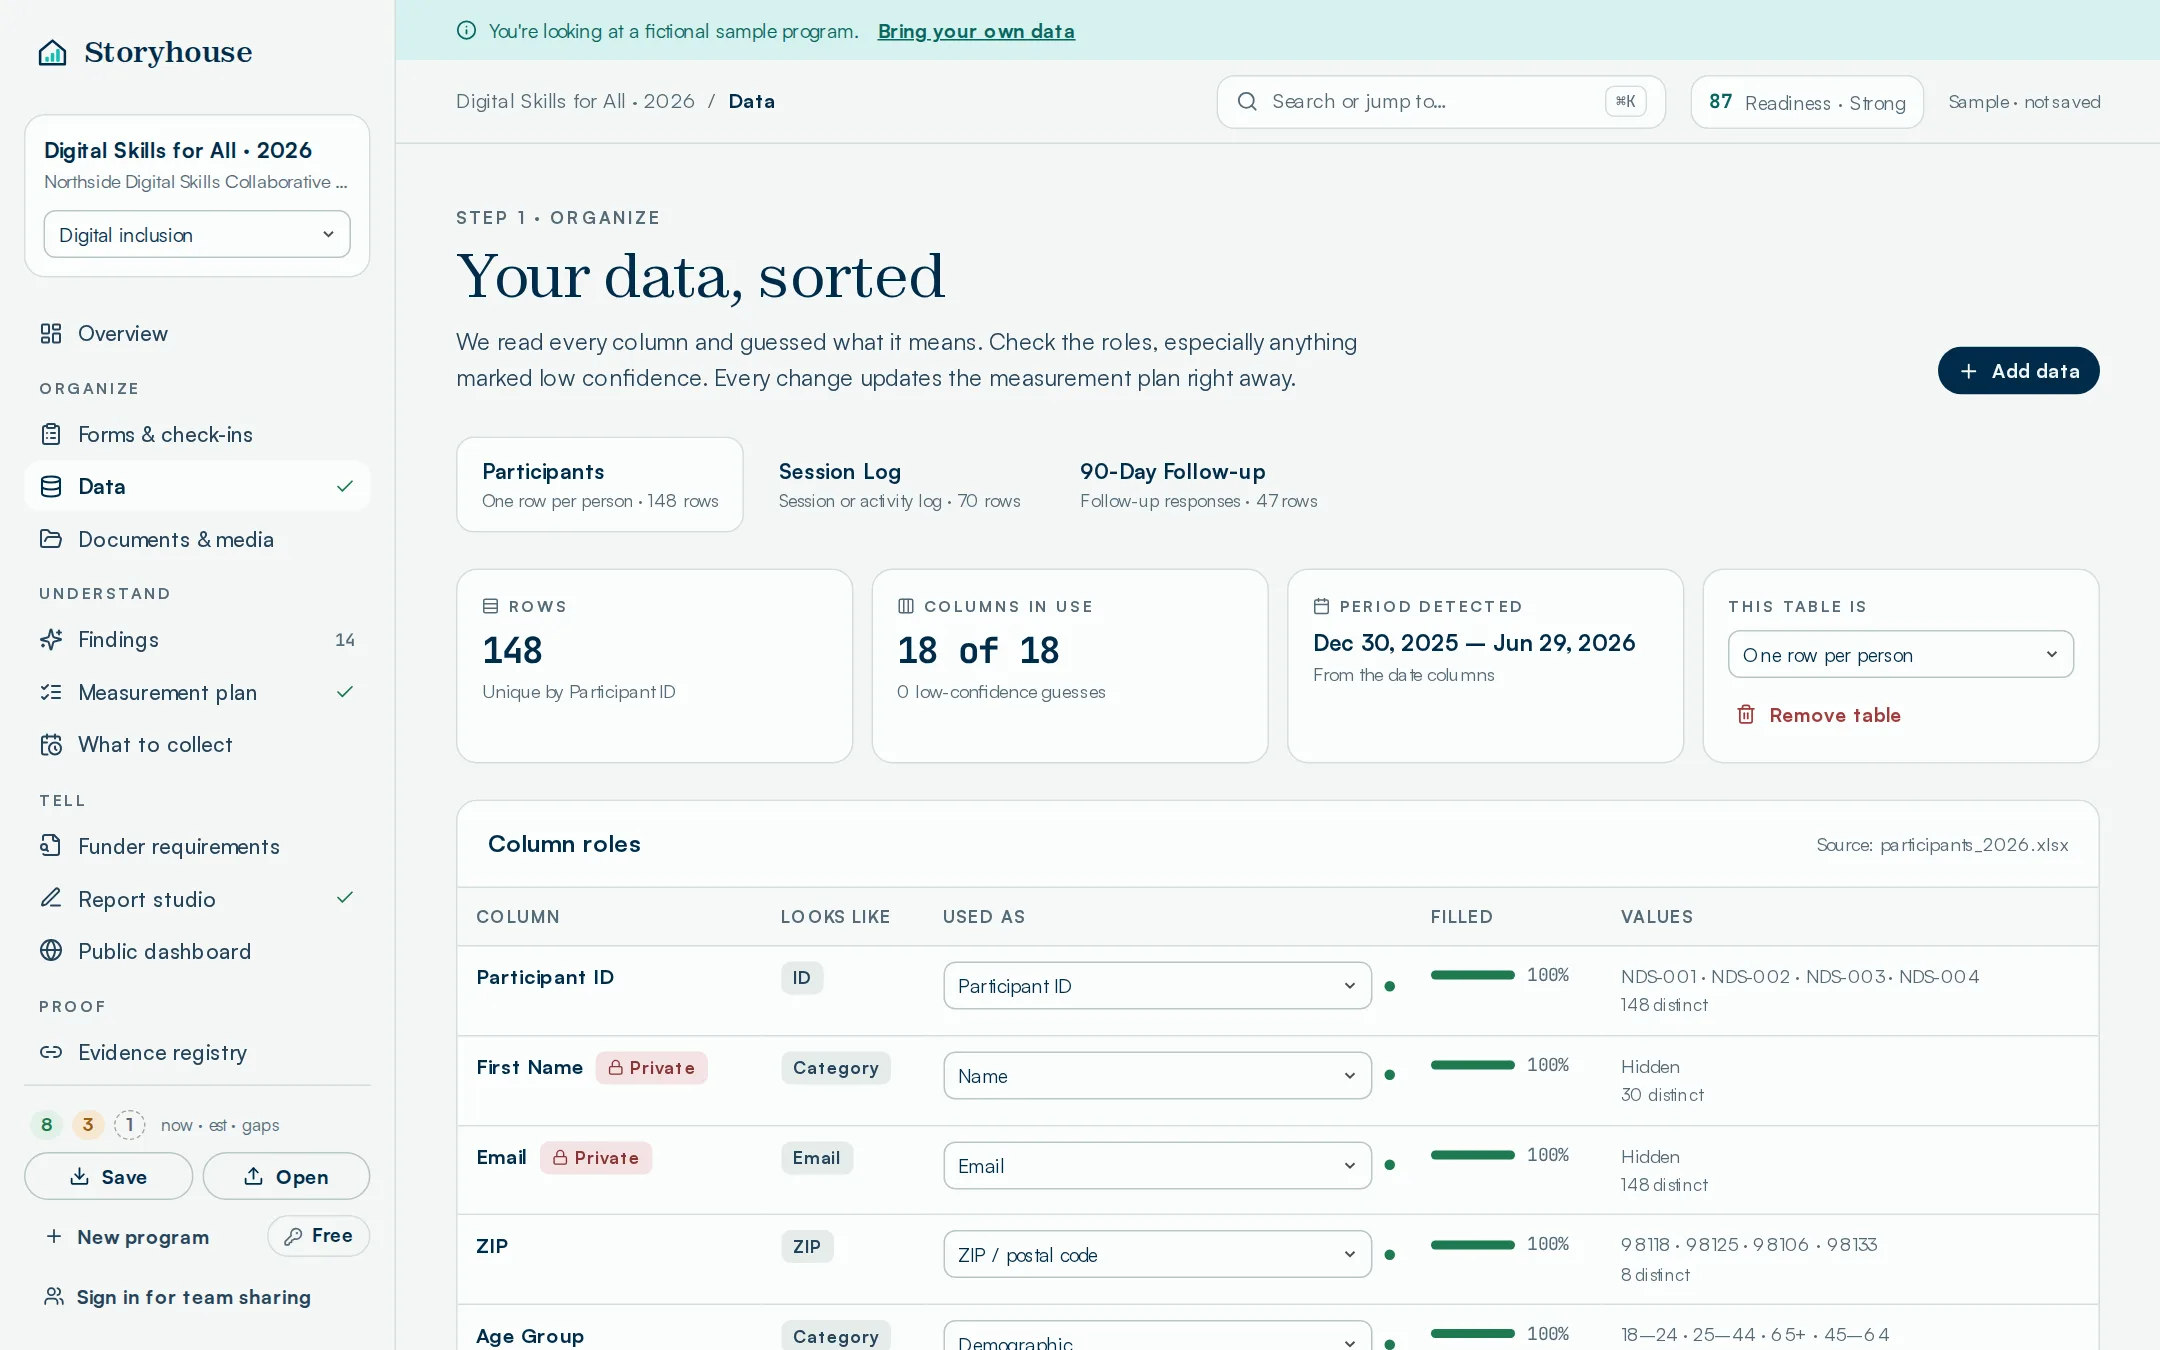
Drop in the spreadsheets, survey exports and sign-in sheets your team already keeps. Storyhouse reads each column, flags names, emails and phone numbers as personal, checks for duplicates and gaps, and links records across files by participant ID. Or start from scratch with ready-made intake, exit and follow-up forms.

Storyhouse data review screen with column checks and personal information flagged
02 · Understand

See what the data can honestly prove.

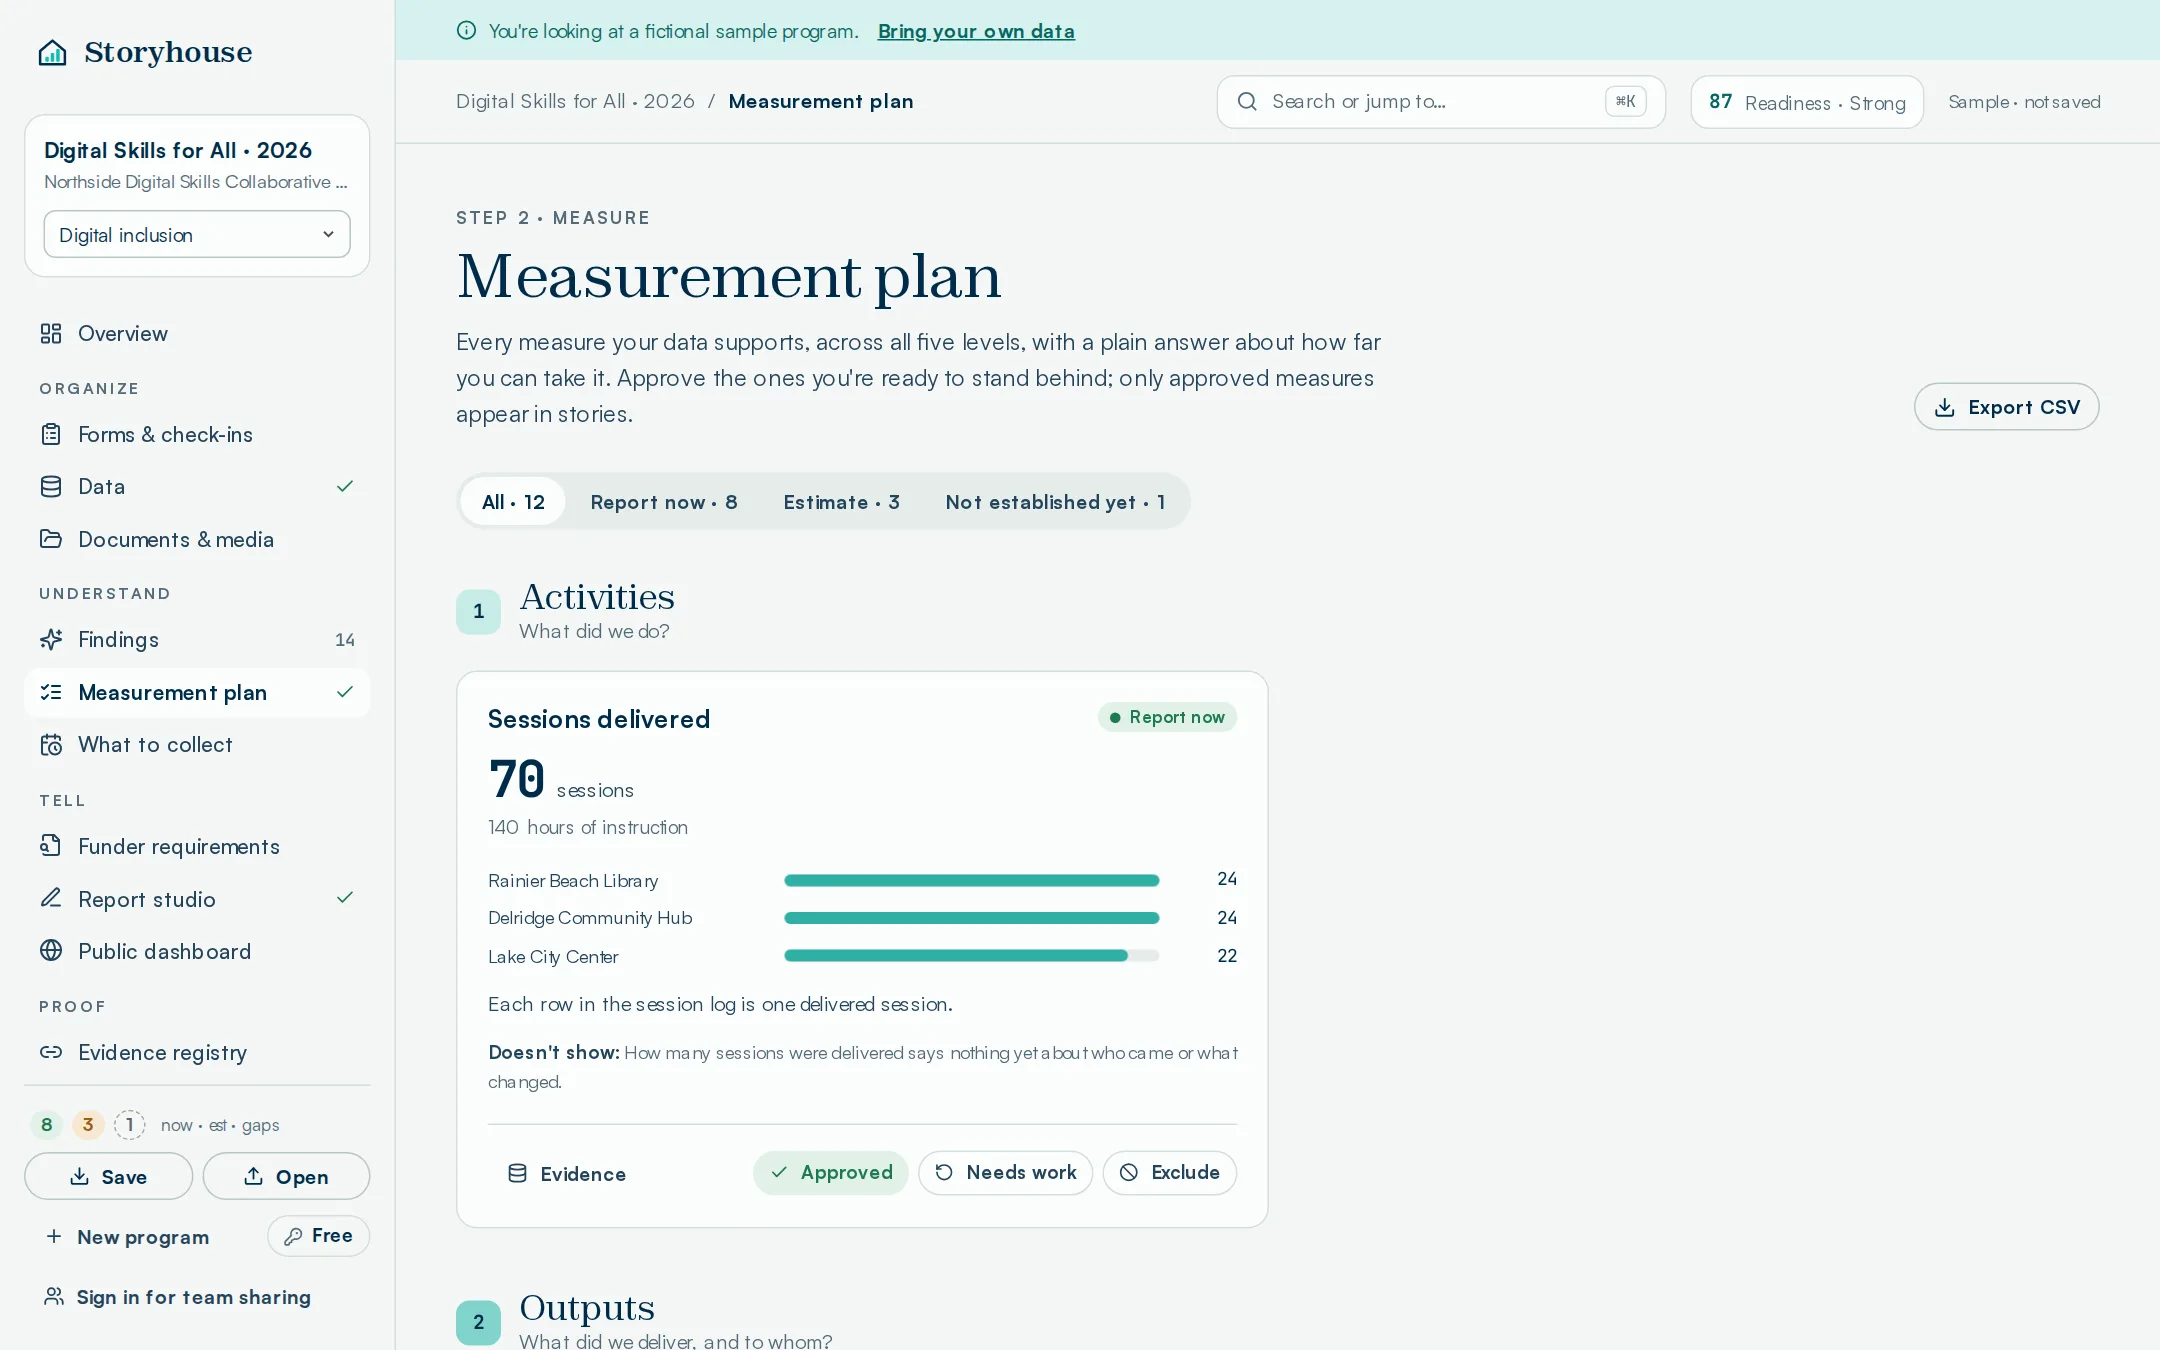
Every measure lands on the evidence ladder, from activities to impact, and is marked report now, estimate or not established yet. Findings are ranked, gaps between groups are surfaced, and the measurement plan tells you exactly what to collect next, and when, to climb a rung.

Storyhouse measurement plan showing what to collect at intake, exit and follow-up
03 · Tell

Publish with receipts.

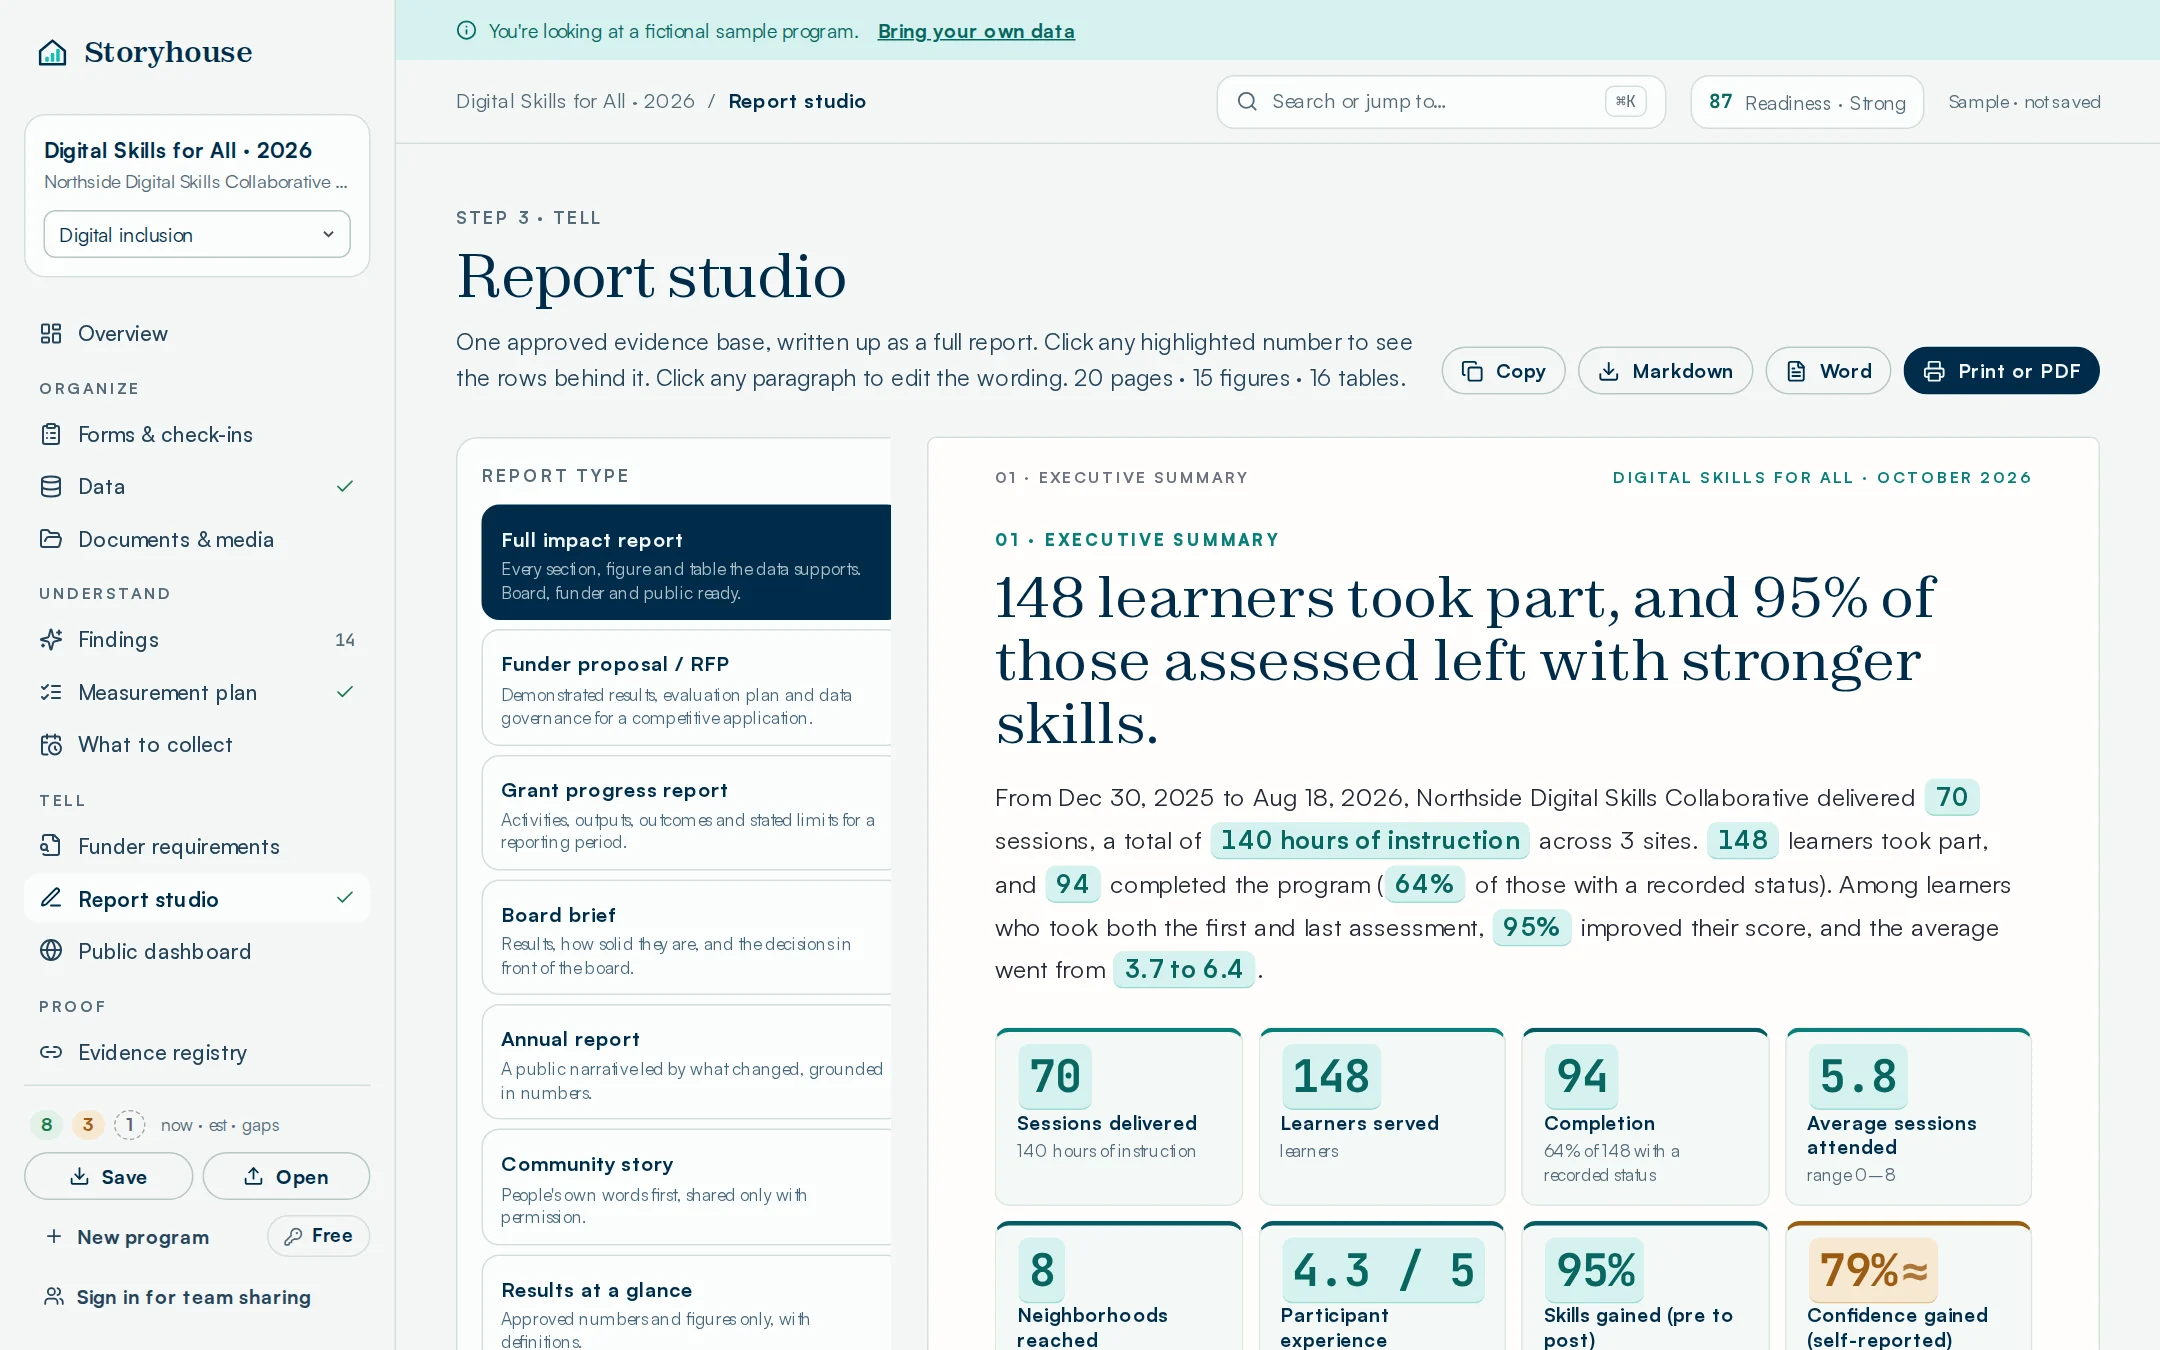
Report studio writes seven kinds of reports from one approved evidence base. Every highlighted number opens the rows behind it. Quotes only appear with consent, small groups are folded in so no one can be singled out, and the public dashboard shows approved measures only.

Storyhouse Report studio with a full impact report cover and report type list
The people behind the number

A funder clicks “95% improved.” They see who, and what changed.

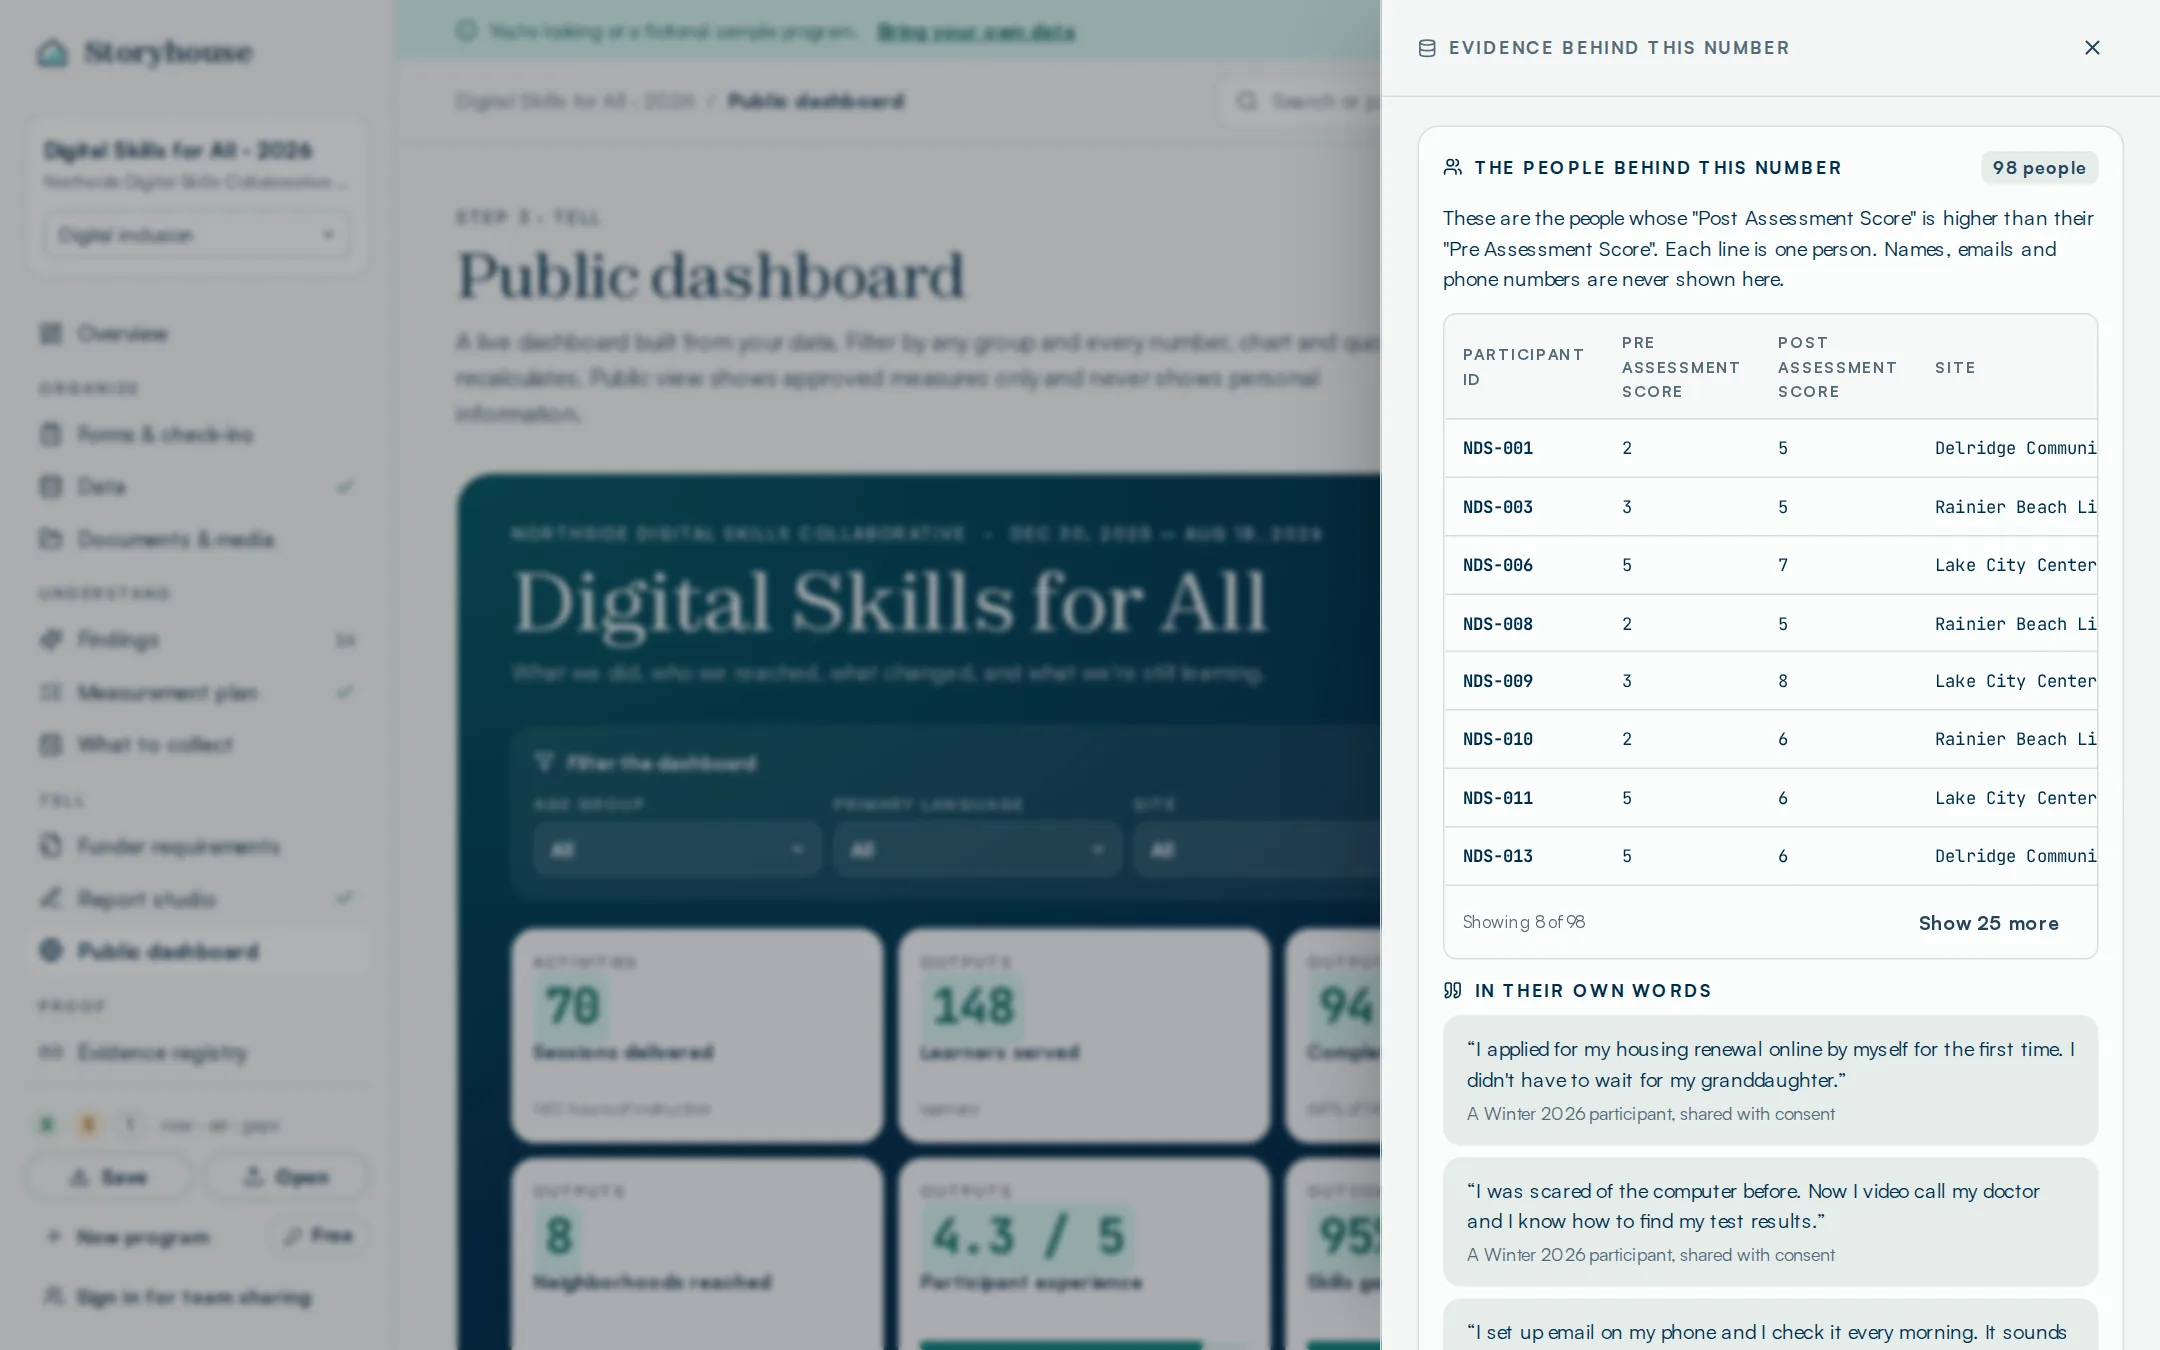
Every number in Storyhouse opens. Behind “98 learners improved their scores” are 98 people, listed by participant ID with their before and after, their site and their cohort, never their names. Where someone said yes to sharing, their own words sit right under the table. It’s the difference between a claim and a receipt, and it’s in every dashboard and every report appendix.

Storyhouse evidence panel open over the public dashboard: the people behind “Skills gained,” 98 de-identified participants with pre and post assessment scores and site, followed by participant quotes shared with consent
  • De-identified by default. Participant IDs, never names, emails, phones or addresses.
  • Only the rows that made the number. No browsing the roster.
  • Stories only with a recorded yes. Small groups are folded in so no one can be singled out.
Why not just use a chatbot?

A chat window writes a paragraph. Storyhouse holds the program.

Plenty of teams will paste a spreadsheet into a general AI tool and get a decent paragraph back. That isn’t the hard part of funder reporting. The hard part is the structure underneath, and that is what Storyhouse is.

It holds your data and your definitions

Plans, records, measures, funder requirements and last quarter’s numbers live in one place with a memory. Every figure links back to its source rows. A chat window holds none of that.

It knows what the funder asked for

Drop in the grant agreement and Storyhouse pulls out every requirement, target and deadline, then shows which ones your records answer today, which are partial and which are gaps.

It asks the same way every time

The in-house version is one smart person with a prompt, until that person leaves or asks differently in March than in January. Storyhouse keeps the history, so the next report is faster than the last.

Participant records never go to a chatbot

Pasting case data into a general AI tool is a privacy problem the moment it happens. Storyhouse keeps records in an encrypted, role-controlled database and uses AI only where it’s safe to.

Built on fifteen years of data houses

The Data Guys™ has built data systems for federal agencies, multibillion-dollar construction companies, public agencies and community organizations. Storyhouse is that method, packaged for teams who can’t hire for it.

Use the chatbot too, if you like

Nothing stops you. Teams that try it in-house find out fast that most of the work is the data house, not the writing. That’s the part we built.

Inside the report

A report your board reads and your funder trusts.

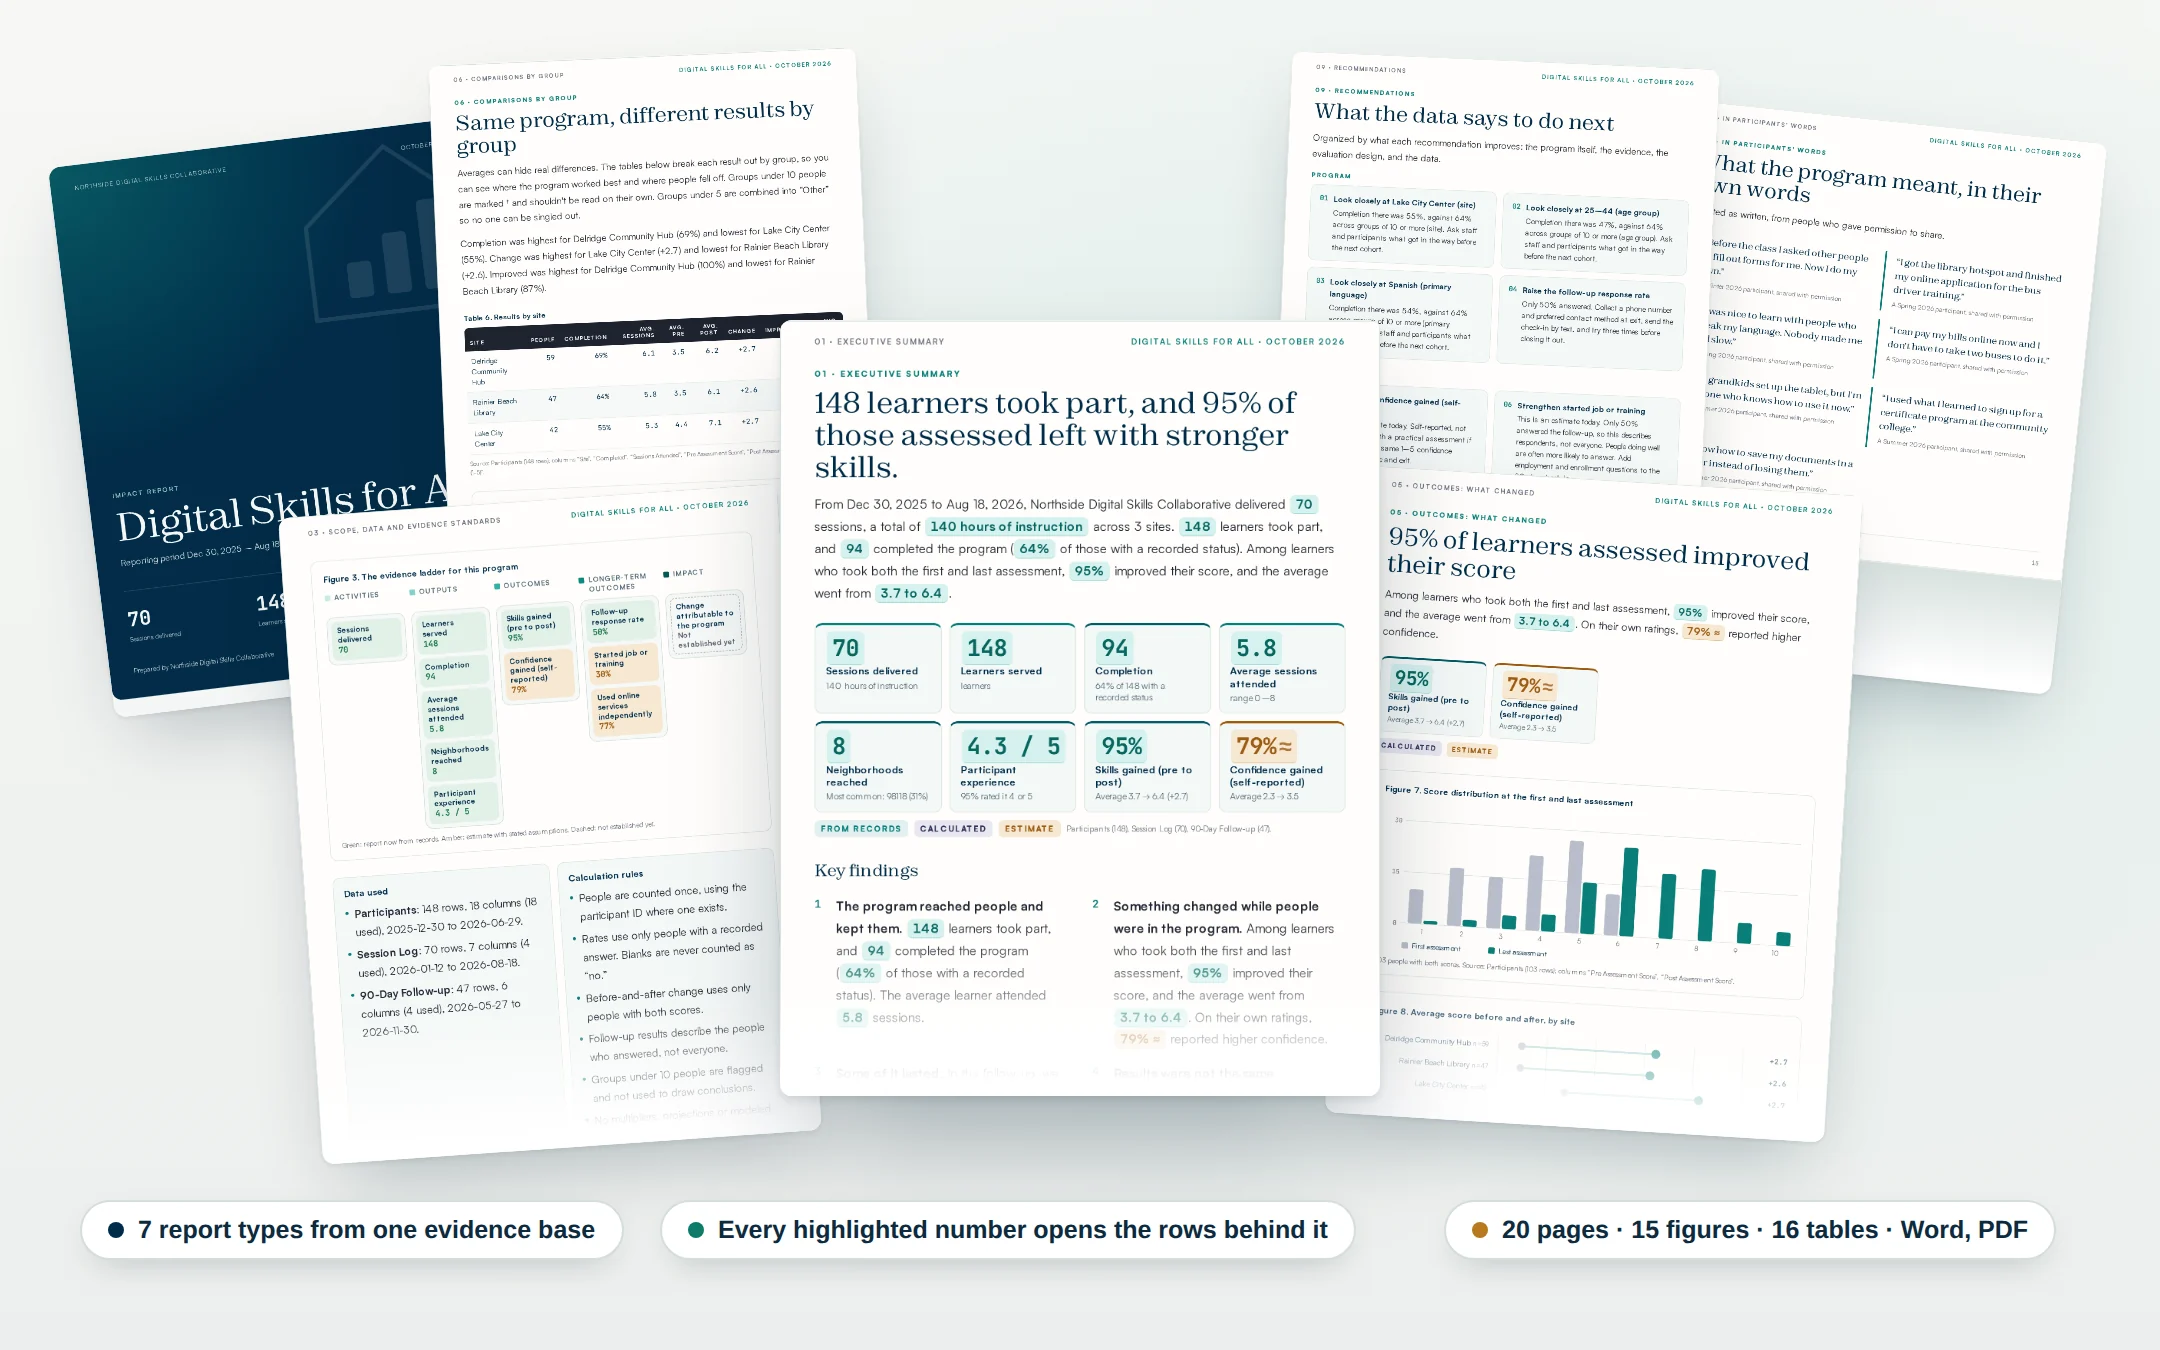
These are pages from the sample program’s 20-page impact report. It has an executive summary with the numbers that matter, charts of what changed, results by site, cohort, age and language, the evidence ladder, recommendations, and participants’ own words, shared with permission. Every number links to a definition and its source rows in the appendix, and the whole report downloads as Word or PDF.

Pages from the Storyhouse sample impact report: cover, executive summary with key numbers, outcome charts, the evidence ladder, results by group, recommendations and participant quotes
What’s inside

Everything between the sign-in sheet and the board meeting.

Forms & check-ins

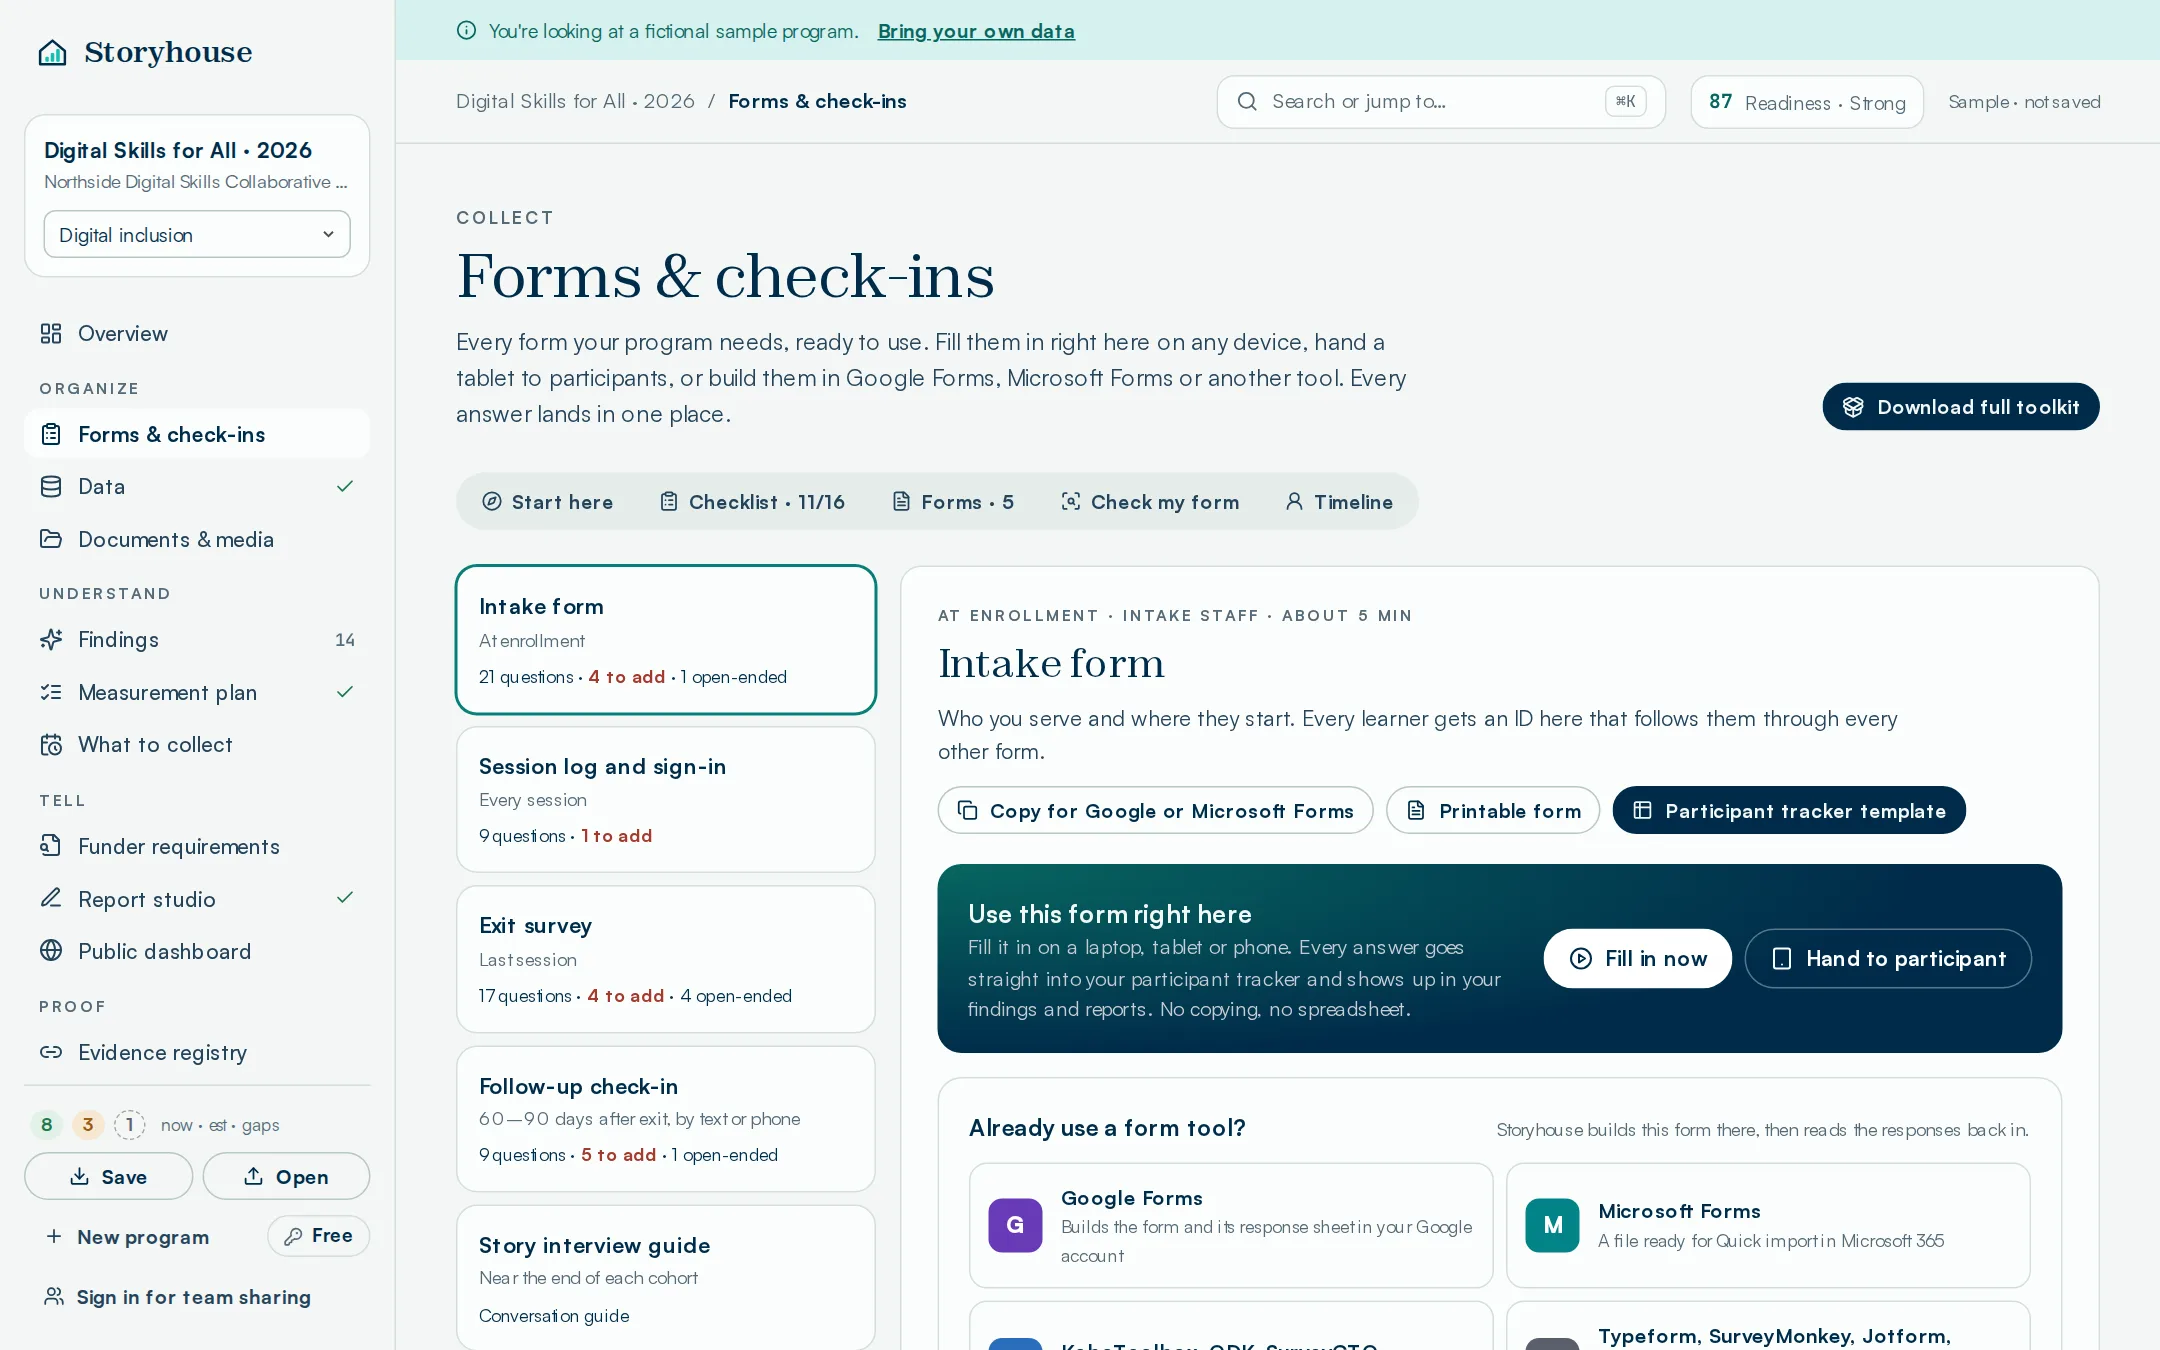
Intake, session sign-in, exit survey, follow-up check-in and a story interview guide, ready to use. Fill them in on any device, hand a tablet to participants, share any form by link or QR code, or build them in Google Forms, Microsoft Forms or KoboToolbox. Follow-ups go out as personal links already matched to each person.

Data import and review

CSV and Excel, many files per program. Column-by-column checks, duplicate and gap detection, and record linking by participant ID. Download it all back as Excel or CSV any time.

Evidence readiness score

A 100-point read on evidence depth, data quality, staff review, follow-up and stories, with the next three moves that raise it.

Measurement plan

What to collect, from whom and when, mapped to Activities · Outputs · Outcomes · Longer-term outcomes · Impact.

Funder requirements

Load each funder’s required measures and targets once, then track progress against every grant on one page.

Report studio

Full impact report, funder proposal or RFP, grant progress report, board brief, annual report, community story and results at a glance. Your logo, your colors, and a funder or partner logo on the cover. Word, Markdown and PDF.

Public dashboard

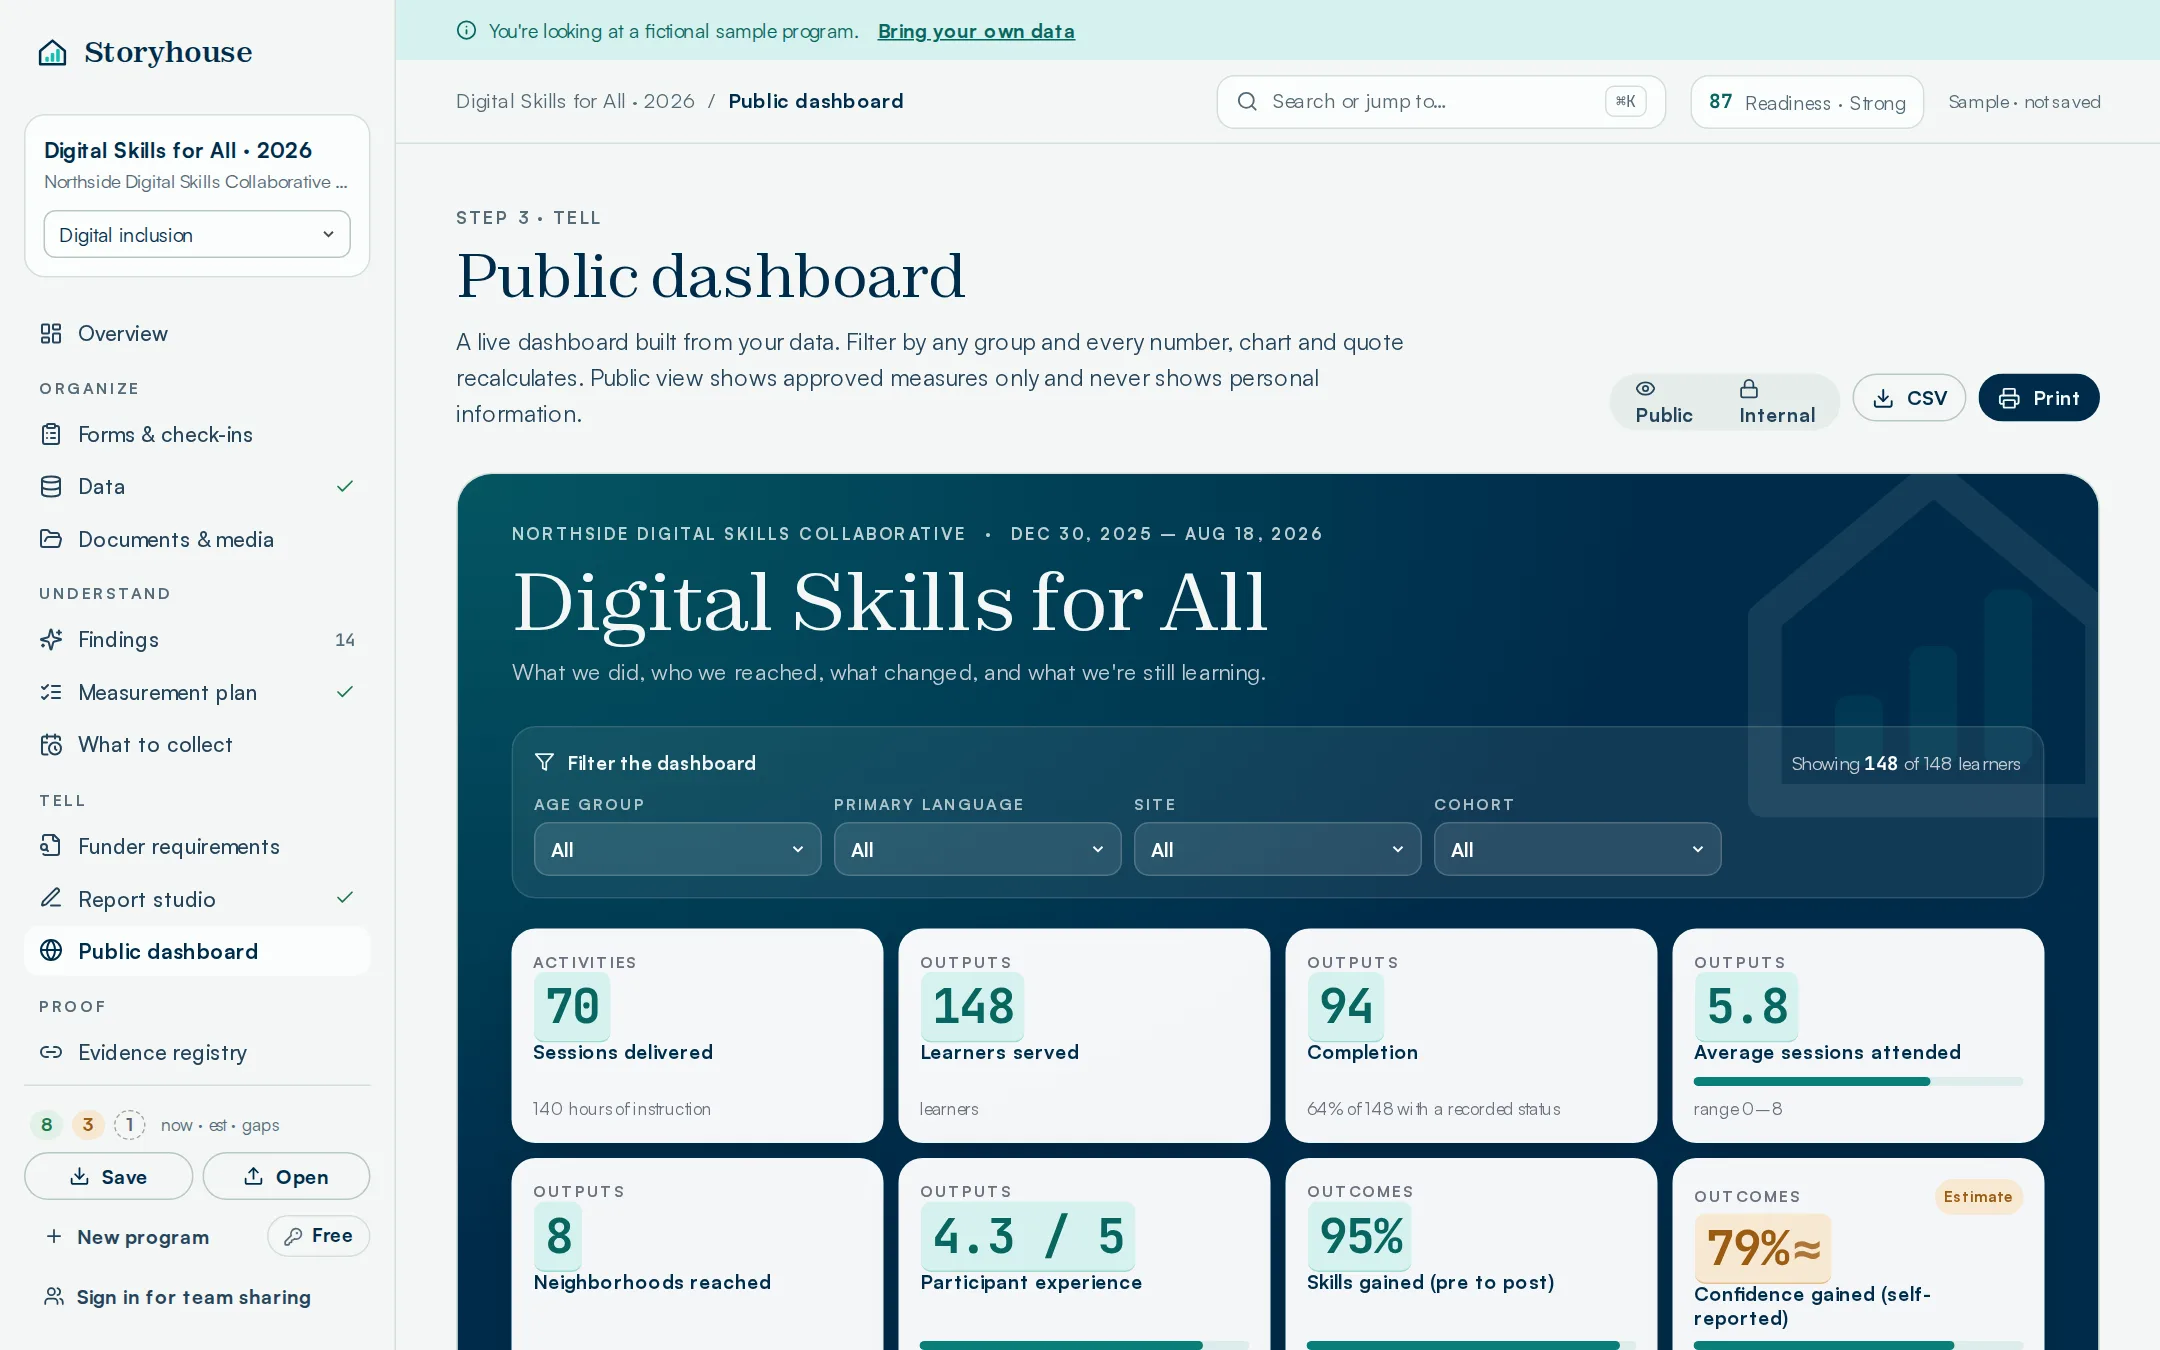
Filter by any group and every number recalculates. Public view shows approved measures only and hides any group under five people.

Stories with consent

Quotes appear only when someone said yes, always without names. Photos stay out until they’re cleared for use.

The people behind every number

Click any figure and see the de-identified people who produced it, with their own words where they said yes. The same appendix goes into every Word and PDF report.

Storyhouse public dashboard with filters and output and outcome cards
Storyhouse forms and check-ins with intake, exit and follow-up forms
Built for teams

One agency. Everyone on their own login.

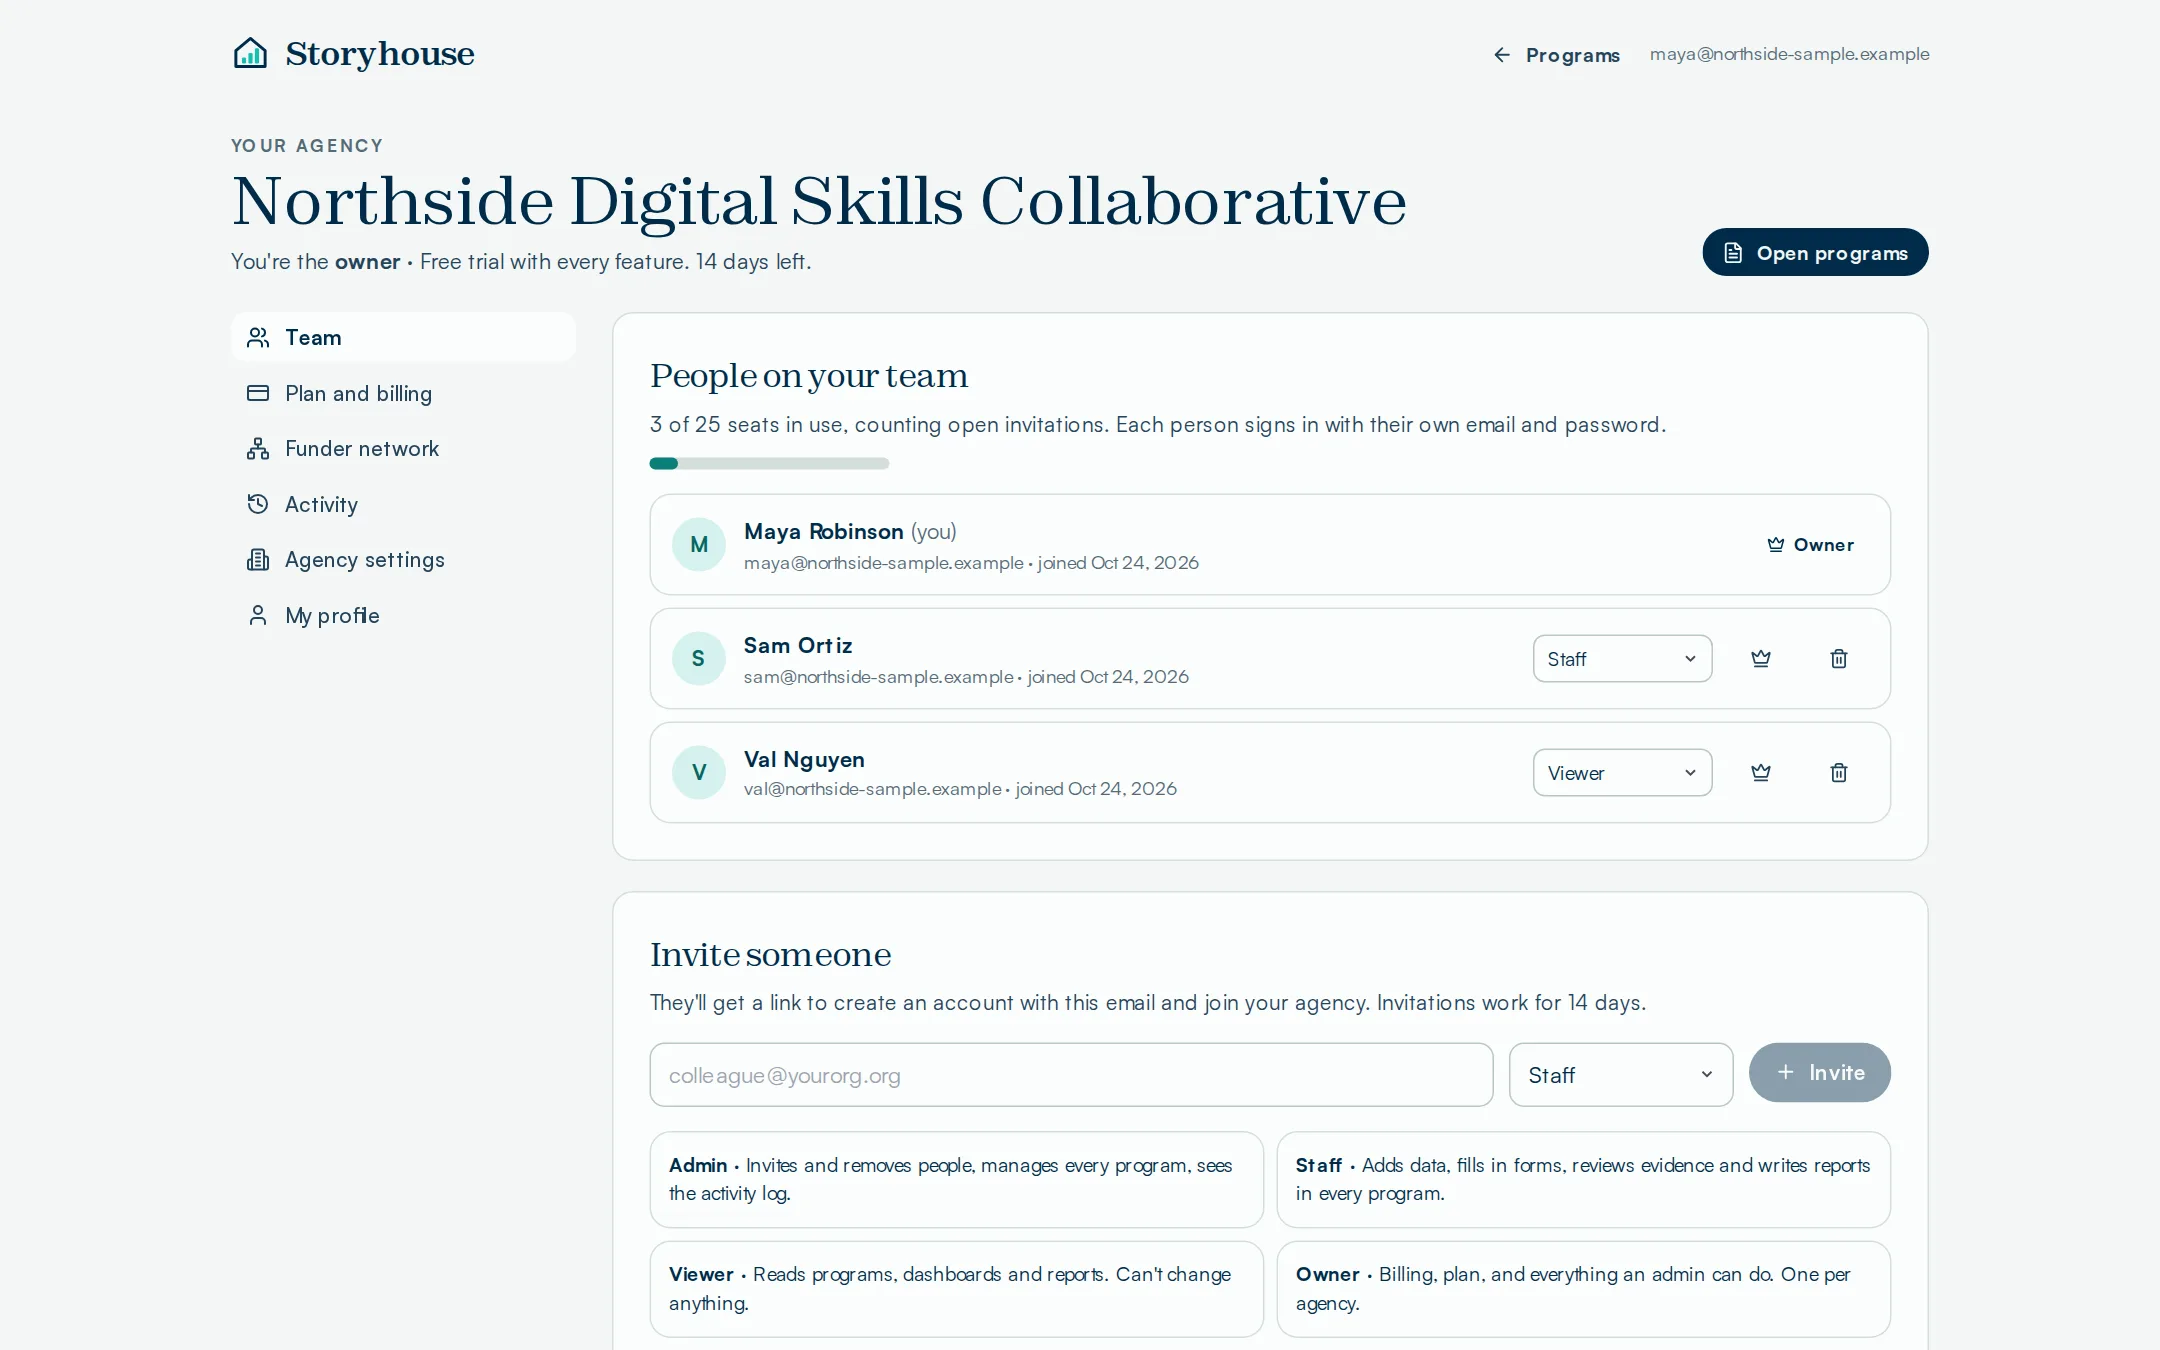
Your agency is your team’s shared home. Programs autosave for everyone, and if two people change the same program at once, Storyhouse catches it and lets you choose which version to keep.

OwnerPlan, billing and everything an admin can do. One per agency, and ownership can be handed over.
AdminInvites and removes people, manages every program, reads the activity log.
StaffAdds data, fills in forms, reviews evidence and writes reports in every program.
ViewerReads programs, dashboards and reports. Can’t change anything. Made for boards and partners.
  • Invite by email. The link only works for the address you invited.
  • Activity log of who joined, role changes, programs and shared reports
  • Move a seat to someone new the day a person leaves
  • Belong to more than one agency and switch between them
Storyhouse team page showing seats in use, roles and open invitations
For funders and intermediaries

See across your grantees without touching their data.

On the Network plan, grantee agencies join with your network code. Each one works in its own private agency on common measures and forms, and shares finished reports with you when they’re ready. Participant records never leave the grantee. Withdraw a report or leave the network, and access ends right away.

Plans

Priced per agency, not per person. A fraction of an analyst.

Every plan includes every report type, forms, funder tracking, team logins with roles, updates and support. Pay monthly or yearly. Every plan starts with 14 days free, and nothing is charged until the trial ends.

Program

$1,800 per year

or $180 a month

One organization with one to three programs

  • Up to 5 people on your team
  • Up to 3 programs
  • All seven report types and the public dashboard
  • Word, Markdown and PDF export
  • Forms & check-ins, participant mode, Google, Microsoft and Kobo forms
  • Funder requirements and target tracking
  • Email support

Organizations with budgets under $500,000 pay $1,200.

Start free trial
Recommended

Agency

$7,200 per year

or $720 a month

Organizations with several programs, sites and funders

  • Everything in Program
  • Up to 25 people on your team
  • Unlimited programs
  • Onboarding with The Data Guys™ included: forms, measurement plan and first funder tracker set up with your team
  • Priority support
Start free trial

Network

$24,000 per year

Billed yearly

Funders and intermediaries overseeing providers

  • Unlimited people on your own team
  • Up to 15 grantee agencies join your network, each on their own logins
  • Grantees share finished reports with you; their participant data stays with them
  • Common measures and forms across the network
  • Network roll-up reporting prepared by The Data Guys™ each quarter
  • Grantee training workshop
  • $1,200 per year for each additional grantee
Talk with us about a network

Data House

from $18,000 per year

Scoped with you, billed yearly

Agencies and funders that want their systems connected and their data warehoused

  • Everything in Agency
  • Scheduled imports from your case-management system: Apricot, Salesforce NPSP, ETO, CommCare and others
  • A relational data layer under your programs: participants, enrollments, services, measures and outcomes
  • Read-only reporting connection for your analyst or BI tool
  • Quarterly working session with The Data Guys™
  • Implementation by the team that has built data houses for fifteen years
Talk about Data House

Prices are per agency. Pay yearly, or monthly at a tenth of the yearly price (yearly saves two months). Network is billed yearly. Agency includes onboarding with The Data Guys™. Data House is scoped and priced with you, starting at $18,000 a year. Washington sales tax is added at checkout where it applies. Extra seats on Program and Agency are $10 per person per month. Pay by card, bank transfer, invoice or purchase order (30-day terms). Full refund within 30 days of your first purchase. Questions about a plan? Email us or book a 30-minute walkthrough

Security and privacy

Participant trust is the whole point.

The people in your programs shared their information with you, not with the world. Storyhouse is built to keep it that way.

Read the full security overview
Locked to your agencyRow-level security inside the database walls each agency off from every other one.
Encrypted, US-hostedHTTPS in transit, AES-256 at rest, hosted in the United States. Download a backup any time.
Roles and an audit trailOwner, admin, staff and viewer, plus account and program activity logs.
Consent built inNames, emails and phones masked automatically. Quotes need a yes, photos need clearance, small groups are folded in.
Your data stays yoursNever sold, never used to train AI. Download a full backup any time.
No trackingNo analytics, advertising or tracking code anywhere in the app.
Questions

What teams ask us first.

Something else on your mind? Email info@thedataguys.org. A person reads every message.

You can write a paragraph that way, and some teams do. What a chat window can’t do is hold your program: the records, the definitions, the funder’s requirements and last quarter’s numbers, with every figure linked to the de-identified people behind it. It also can’t keep participant records out of a general AI tool, which matters the moment case data is involved. Storyhouse is the structure underneath the writing, and it asks the same questions the same way every reporting cycle.

Your next funder report could be the easy one.

Create your agency, bring one spreadsheet, and see what your data can already prove, and who is behind every number. It takes about ten minutes.